

Say the word ‘infographic’ and not everyone will know what you’re referring to; but say the words ‘London Tube map’ and most people would immediately visualise (a less-detailed version of) the following:

As probably one of the most well-known infographics in the world, this provides an excellent demonstration of the potential power a well-designed infographic can muster. Transferred into the language training classroom, the importance and impact of the infographic remains highly relevant; especially as it’s estimated that the majority of people (around 65%) are visual learners, who are naturally more attracted and engaged by image, over text. In the true spirit of infographics, we’ve created one to represent just a few of the compelling reasons language teachers and students should start integrating them into lessons and self-study today. Take a look:
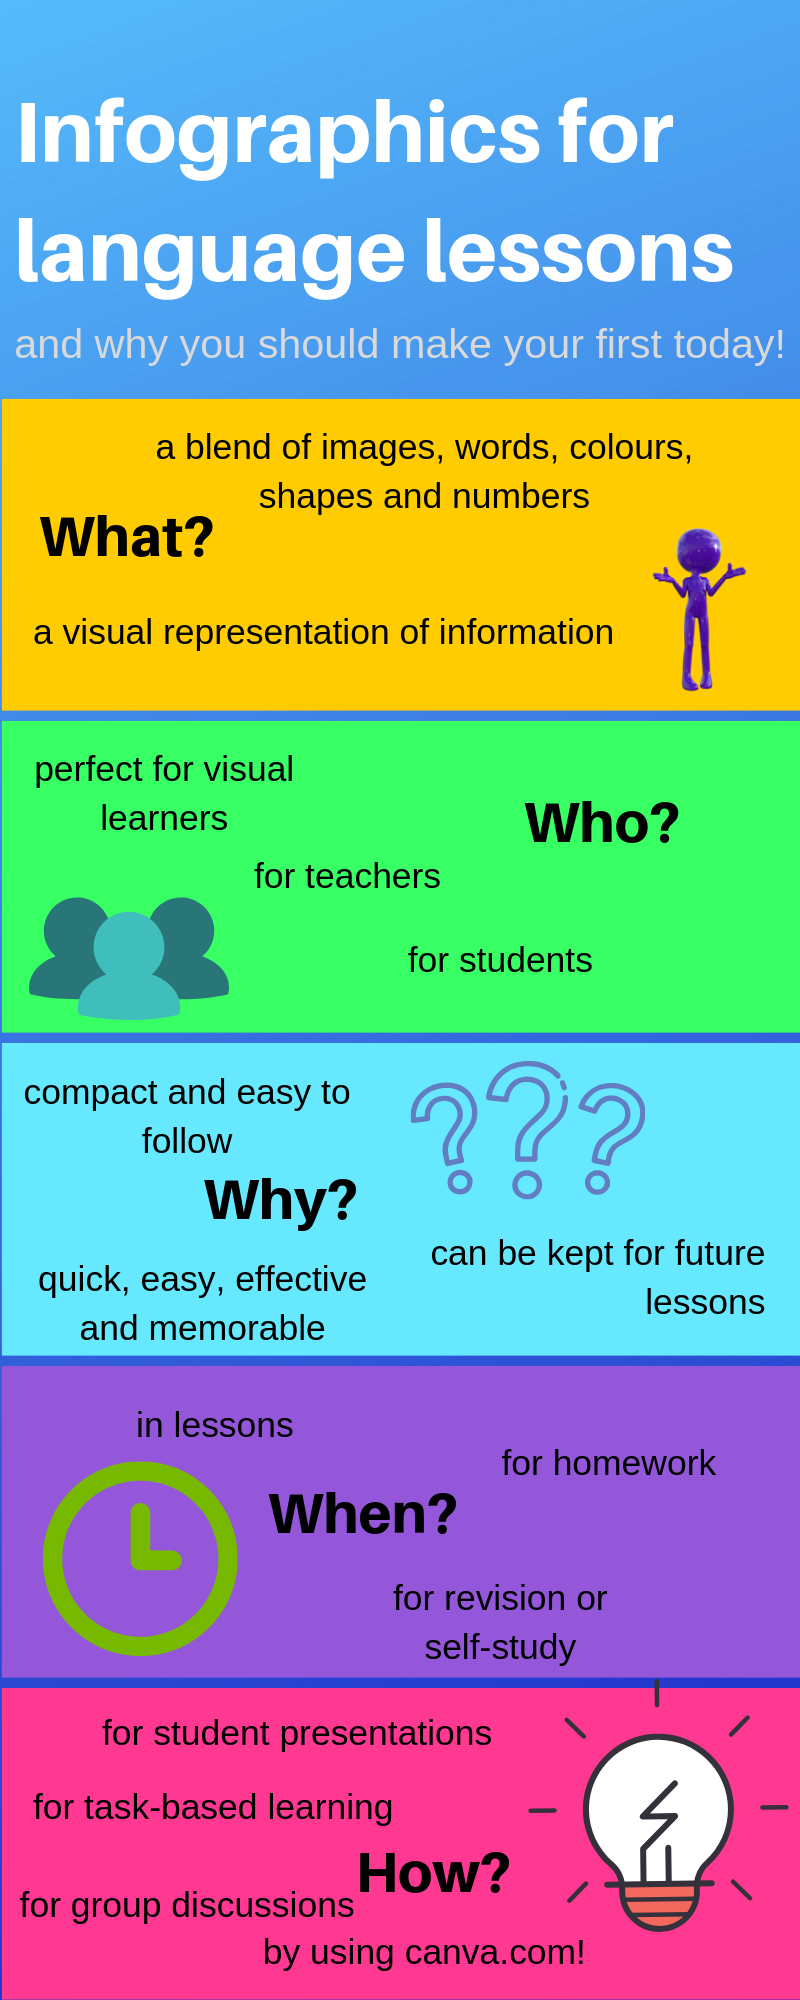
To design the example above, we used www.canva.com but there are other free platforms you could try out; such as: www.piktochart.com or www.easel.ly. So, why not have a go at creating your own infographic today? If you’re a teacher you could set up a Task Based Learning lesson by following these steps:
Create an infographic, using one of the websites above, focussing on the vocabulary and grammar your students would need to work in a group and design something visual and informative. For example, in English – modal verbs ‘could’, ‘should’, making suggestions – ‘let’s + verb etc.
- Present the infographic to your students in the next lesson, highlighting and checking understanding of the vocabulary and grammar included by using CCQs (Concept Checking Questions)
- Demonstrate to your students how you made the infographic
- Explain the task to your students: to work together to create an infographic on a topic of their choice, whilst making sure to use the target language you introduced in your own infographic (it would be a good idea to do some pronunciation drilling at this point)
- Monitor the students whilst they’re doing the task and make a note of any common errors in the target language
- Students present their infographic to the class
- Conduct error correction with the notes you’ve made – write example sentences on the board and elicit corrections
- Set homework or self-study activities to create more infographics
If you’re a student, why not try the following self-study activity:
- Select a topic you could use for an infographic (something related to your course, your job, your future plans etc.)
- Do some research on the topic (ideally in the target language) and make a note of the specific vocabulary, grammar and facts etc. needed
- Use one of the websites above to design and create an infographic
- Share the infographic with your teacher for feedback, make any corrections or amendments he/she suggests, offer to present to the class
- Go on to create a series of infographics in the same manner and keep for revision activities etc.
If you do decide to have a go at any of the above, please do get in touch to let us know how it goes!
About the author:
 |
Anna is a CELTA and Trinity Dip-TESOL qualified English language teacher, with a background in Academic Management. |
Our teachers at Professional Language Solutions understand the importance of providing engaging, interactive and meaningful material in language training lessons. Memorable material encourages speedier language acquisition, student confidence and ultimately a better return on investment. This email address is being protected from spambots. You need JavaScript enabled to view it. to discuss how we can help with your language training needs.